Using Graphs
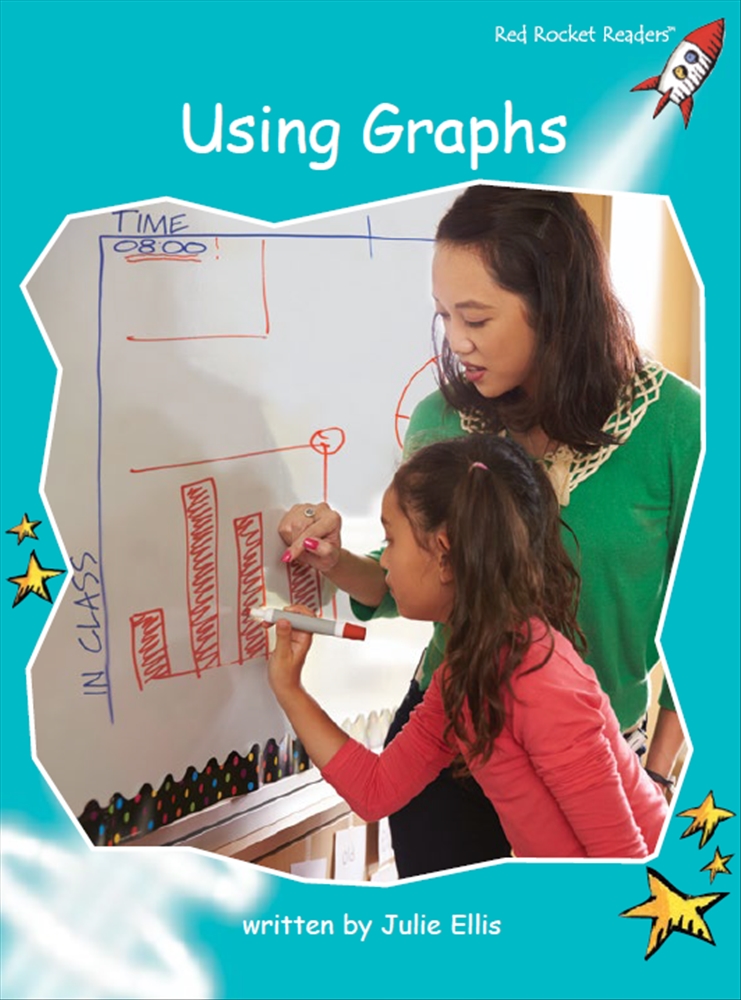
A graph is a picture or chart showing the differences between things that we can measure. It helps us to understand information when we can see the facts in a picture. We use different kinds of graphs to show different kinds of information.
 Download Worksheet (Registration and Login required). View all available Worksheets here
 Please visit Lerner Books to place your order.
Additional information
| Page Count: | 16 |
|---|---|
| Word Count: | 359 |
| Belongs to Set: | Fluency Level 2 Non-Fiction Set A |
| Fiction or Non-Fiction: | Non-Fiction |
| Genre: | Procedural |
| Guided Reading Level: | K |
| Reading Recovery Level: | 18 |
| Lexile Measure: | BR80L – 480L |
| DRA Level: | 20 |
| Author: | Julie Ellis |
| ISBN - Standard Edition | 9781877435171 |
| ISBN - US Edition | 9781877435669 |
| Artifact Tags: | Picture/Text Correlation, Punctuation and Mechanics, Emergent Reader, Table of Contents/Index, Informational text, Charts and diagrams, Graphing |
| Keywords: | would, things, when, more, how, need, show, part |
| Common Core State Standards: | CCSS.ELA-LITERACY.RL.2.1, CCSS.ELA-LITERACY.RL.2.3, CCSS.ELA-LITERACY.RL.2.5, CCSS.ELA-LITERACY.RL.2.7 |
| EL Education Alignment: | 2-1 Schools and Communities |
| TEKS: | TEKS§110.4(b)(6), TEKS§110.4(b)(8) |


